Measure service desk performance

Drive service desk efficiency by identifying bottlenecks and keeping track of key performance indicators (KPIs) with pre-defined reports for incidents, changes, and assets. Stay on top of SLAs by organizing the insights you discover into tailored reports.

Easily identify and resolve issues, and plan your investments by viewing the real-time data as presentations, and share the reports by various filters or formats of your choice.

measure service desk performance 2x measure service desk performance 2x

Gain insights into all modules

Leverage reports based on different impacts, groups, types, associations, or even department to pinpoint areas of improvement and keep tab of its performance with periodic checks.

Review report data to track the health of all associated incidents, problems, or changes and minimize risks or disruptions to the business. Make quick, informed decisions with accurate data across all modules in the service desk.

gain insights into all modules 2x gain insights into all modules 2x

Visualize reports for greater visibility

Provide clarity into the data you want to see or present by using the data visualization engine. With automatic recommendations as well as the option to use Smartboards to browse interactive visualizations, view or present the analytics you require for greater understanding.

Easily break down insights, plan better, and improve your service desk performance.

visualize reports for greater visibility 2x visualize reports for greater visibility 2x

Ask Freddy in plain English to get your service metrics


Build extensive reports easily with Ask Freddy, our home-grown AI platform. Ask Freddy uses Natural Language Processing (NLP) to understand your query and fetch the data you need instantaneously. This data can then be added to an existing report with just one click. Freddy also shows the filters applied to fetch this data, so you can make changes/configurations for deeper granularity. 

NLP for ITSM Analytics NLP for ITSM Analytics

Perks of advanced reporting and analytics
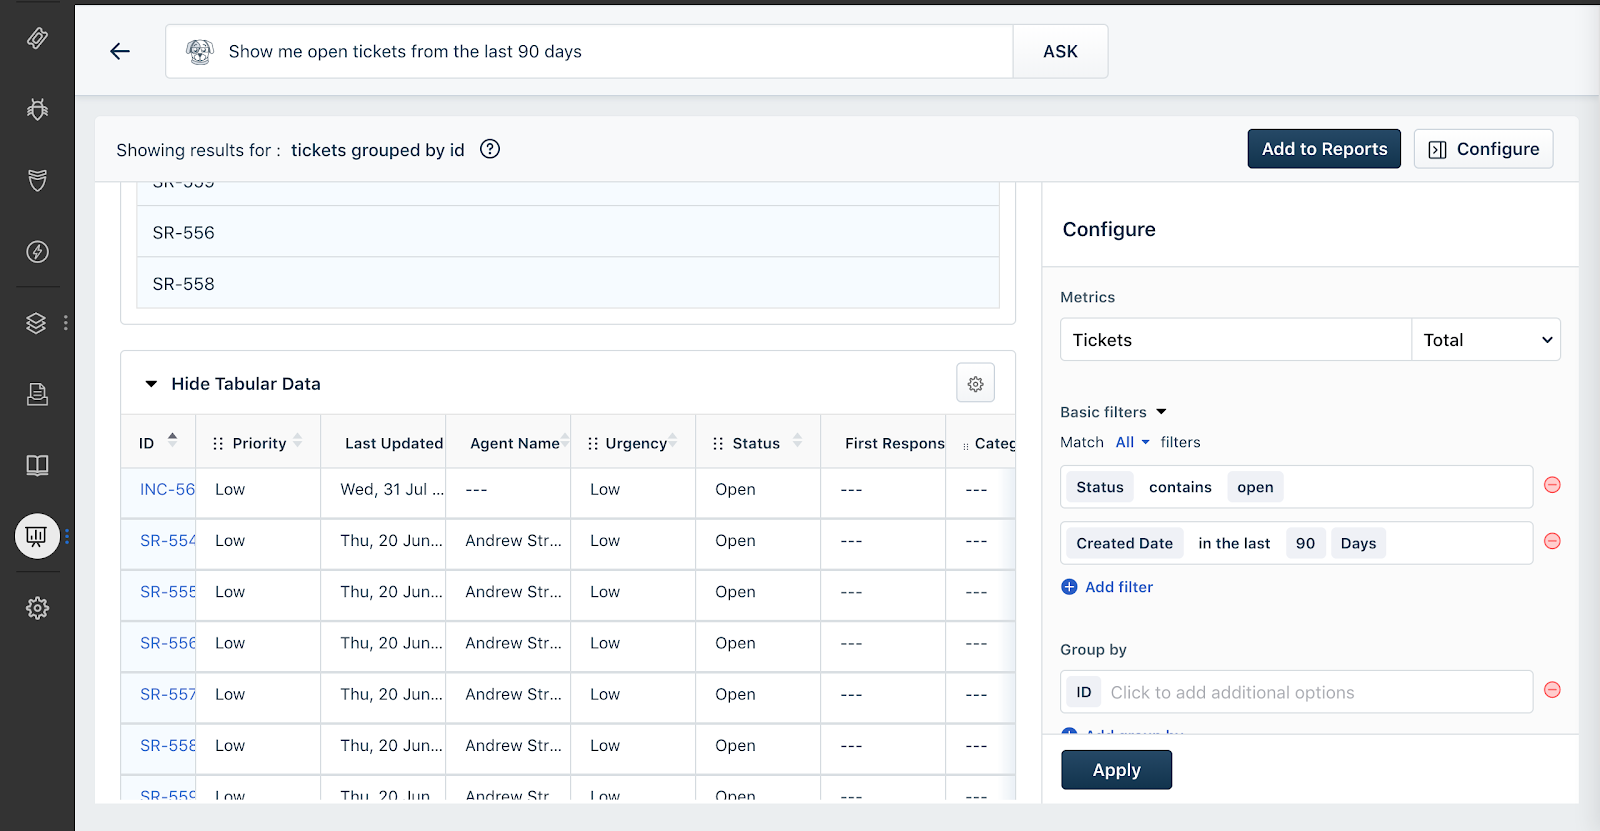
Search

Ask questions about your service desk data instantly using the Natural Language Querying engine that requires no training. Build custom visualizations, add filters, and even ask questions using a search bar
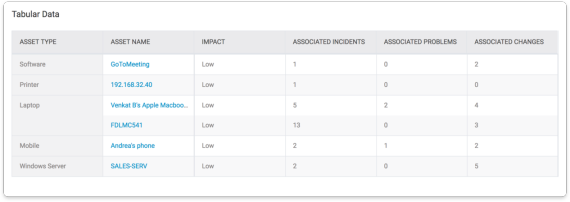
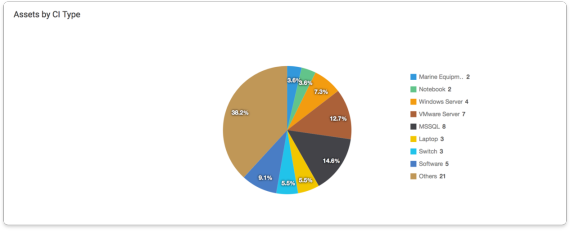
Curated reports

Access curated reports for quickly sharing top-level data with the stakeholders. To personalize them, filter the relevant data, and generate the report in a format of your choice – tabular, bar chart, or even graphical.

Schedule reports

Automate reports to be shared periodically with relevant stakeholders. Schedule the emails with the data to be sent regularly, in a format of your choice.